Mandelbrot Set
It's time to learn a "new" language and I'm learning Go. Actually, I need to learn Go out of necessity - for some work I'm doing and I might have to teach it as well.
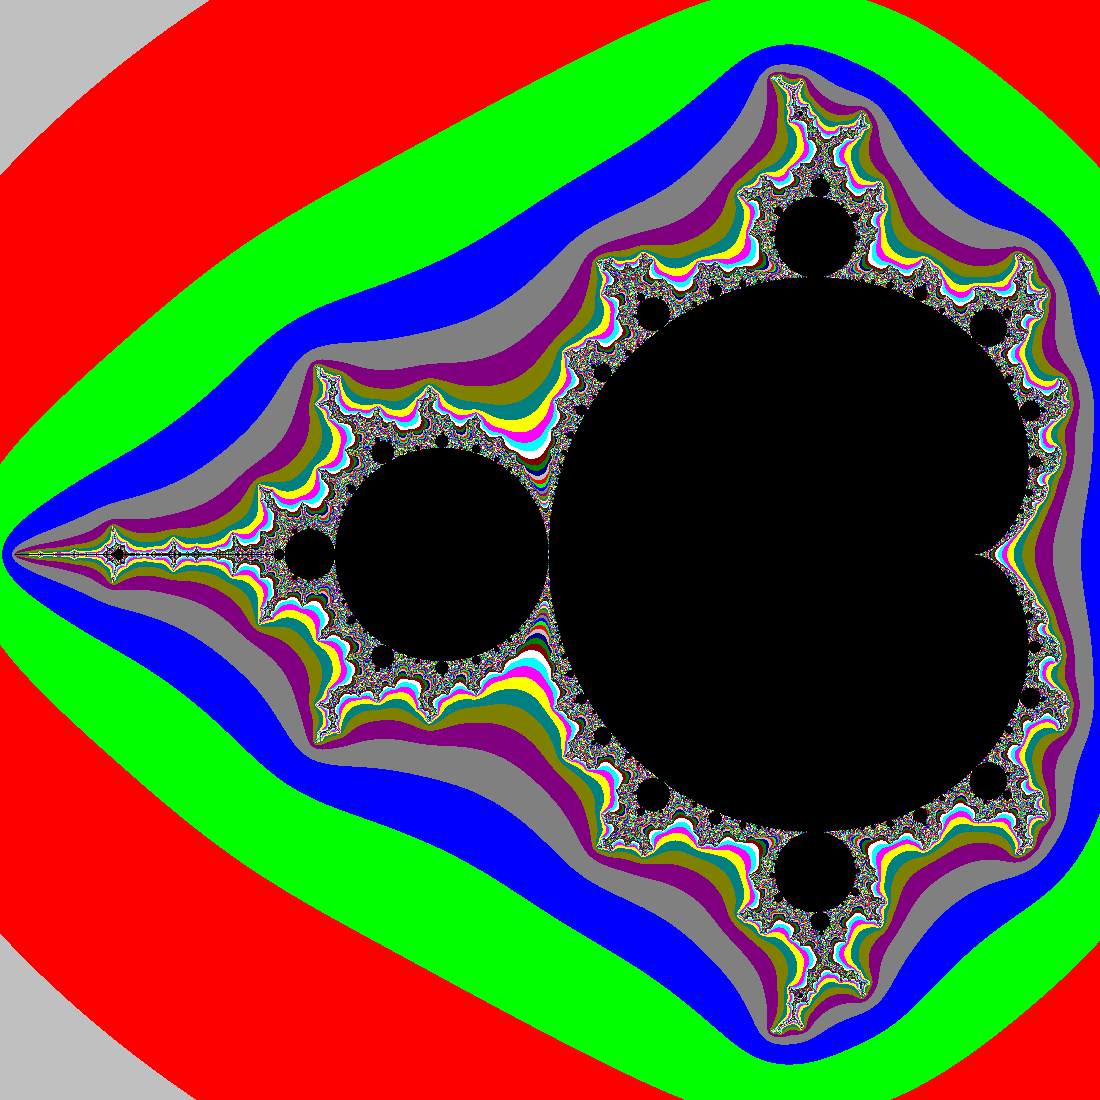
The best way to learn is by doing. This morning I wrote a Go program to plot the Mandelbrot set. Back in the 90s when home computers had the power to compute these things effortlessly, many a night was spent implementing fractal graphics programs**. The set is the set of complex numbers c for which the function f(z) = z2 + c repeated iterated remains bounded. A complex number can be represented by its real part and its imaginary part on a 2d plane. For each c we plot a point of colour based on the number of iterations it takes for the iteration to cross a specified boundary.***
I found an old implementation I'd written in Fortran*. Writing it in Go was more of an exercise of getting use to variable declarations, loops and file layout. For example, there are no while loops, only for loops and this takes a bit of getting used to.
For the graphical output, I found nice and easy to use library gg that handles 2d graphics and outputs PNG files. The listing is below or here to download (with the Fortran too) for convenience. You will need to "go get" the gg library.
// Plot the Mandelbrot Set
//
// This is the Mandelbrot program based on one written in Fortran
// in 1994. It still had the original date stamp on the files.
//-rwxr-xr-x  1 cjep  staff   2182 11 Mar  1994 mandel.for
//
// You will find better implementations and better explanations
//

package main

// go get -d github.com/fogleman/gg
import "github.com/fogleman/gg"

func main() {
  // Tune these to get different pictures
  // We have provided the right values
  // for the traditional "turtle"
  //
  const sleft float64 = -2.25
  const sright float64 = 0.75
  const stop float64 = 1.5
  const sbottom float64 = -1.5
  const srealp float64 = 0
  const simagp float64 = 0
  const outputFile string = "out.png"

  // Maximum number of iterations and max magnitude
  const maxIterations int = 2000
  const magLimit float64 = 10000

  // Vertical Size of the image in pixels
  const size int = 1280

  colors := [15]string {
    "800000", // Maroon
    "008000", // Green
    "000080", // Navy
    "c0c0c0", // Silver
    "ff0000", // Red
    "00ff00", // Lime
    "0000ff", // Blue
    "808080", // Grey
    "800080", // Purple
    "808000", // Olive
    "008080", // Teal
    "ffff00", // Yellow
    "ff00ff", // Magenta
    "00ffff", // Cyan
    "ffffff", // White
  }
  // Pixel size converted to our X & Y axes
  var deltaX float64 = (sright - sleft)/float64(size)
  var deltaY float64 = (stop - sbottom)/float64(size)

  // Pixel indices and colours
  var pixelX int
  var pixelY int
  var color int // an index used to choose a colour XXX

  var conX float64 // Converted position from pixels to floats
  var conY float64
  var magnitude float64
  var x0 float64
  var x1 float64
  var y0 float64
  var y1 float64

  // Graphics - allowing for a wider image
  //
  dc := gg.NewContext(size+160, size)

  // We work through each pixel location regarded as a relative
  // location to our axes determined by sleft & sbottom above
  //
  // We are interested in the complex function f(z) = z^2 + c
  // where c is given by the pixel location.
  // Breaking this out into real & imaginary parts:
  //     f(x, y) = x^2-y^2 + conX   +   i( 2xy + conY)
  //
  // where (conX, conY) is our "pixel" location.
  // For each point, we iterate through this function
  // starting at srealp, simagp. Here x0, y0 are set to srealp & simagp
  // x1, y1 take the "next value" then we past them to x0,y0 for the next
  // loop.
  //
  // We limit the number of iterations by maxIterations,
  // but also by the magnitude mod(z) = sqrt(x^2 + y^2)
  // - we haven't bothered to compute the square root here
  //
  // We want to plot how many iterations we go through at a given point
  // color is really counting the number of iterations we go through
  // we adjust it for 15 colours. Black (or "transparent") pixels
  // will occur in the middle if the iterations continue indefinitely
  // within the limit (we hit maxIterations)
  // f(z) = z^2 + c, c is our pixel location

  for pixelX = 0; pixelX <= size; pixelX++ {
     for pixelY = 0; pixelY<=size; pixelY++ {
        conX = sleft + float64(pixelX) * deltaX
        conY = sbottom + float64(pixelY) * deltaY

        color = 0 // Really counting iterations
        x0 = srealp
        y0 = simagp
        magnitude = 0.0
        for magnitude <= magLimit && color <= maxIterations {
             x1 = x0*x0 - y0*y0 + conX
             y1 = 2*x0*y0 + conY
             color++

             x0 = x1
             y0 = y1
             magnitude = x0*x0 + y0*y0
         }
         // Plot
         if color < maxIterations {
            dc.SetHexColor(colors[(color-1) % 15])
            dc.SetPixel(pixelX, pixelY) // [1]
         }
       }
    }
    dc.SavePNG(outputFile)
 }
 // [1] in my Fortran code, I flipped the Y axis because the program
 // updated the screen interactively using a Fortran graphics library.
 // I haven't bothered here - we output a PNG once
* Yes, I'm old enough to have coded in Fortran. And yes, I'm old enough to have been taught it at University. We were forward thinking and learnt Fortran90.
**We had fewer television channels in those days.
***You will find both better explanations and better examples of code on other web sites :-)